
ire Services need to have a good understanding of risk within their operational areas. Understanding risk allows Fire Services to prioritise community engagement, and a number of authorities examine risk as part of their attendance benchmarks. While Fire Services have been considering risk for many years, the recent HMICFRS inspections have highlighted areas for improvement. Many Fire Services may not have recently reviewed their risk model, and changes to personnel can make it difficult to update a risk model using a consistent and repeatable methodology.

To help address these challenges, Cadcorp has worked alongside UK Fire Services to develop Cadcorp Risk Modeller. Risk Modeller provides analytical functionality for determining risk by combining the effects of spatial and attribute data from a range of different sources. Settings from a previous model can be reloaded to ensure a consistent approach.
Fire Services can determine their own risk methodology and data depending on the scope of the risk model and regional socio-demographic variations. Typical datasets that Fire Services use include Experian Mosaic, 65+ GP access, Census, Ordnance Survey Highways Network and Fire Service incidents including fatalities, casualties and rescues.
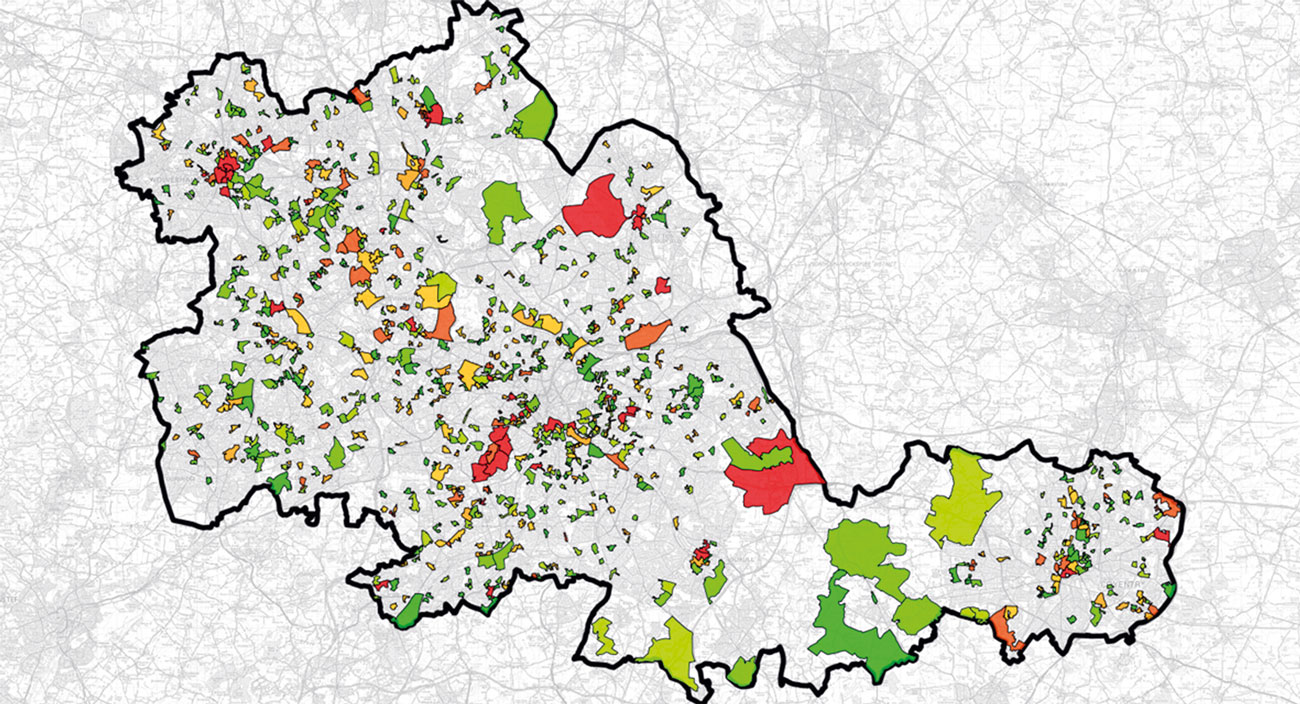
Risk Modeller can be used to create multiple risk maps that can then be combined to create an overall aggregate risk map. The risk maps include:
- Attribute Risk: Using unlimited attributes from a layer, weightings can be assigned to different risk factors, which are then combined to produce an aggregate risk figure for an area. Attributes such as demographic, census, economic and population data can be used. These queries can be saved, loaded and recalled.
- Quantitative Risk: This technique aggregates point data according to the boundary features they fall within. The point data can be counted using geographic features, an automatically created grid or using an attribute for greater granularity.
- Life Risk: Fatalities, casualties and rescues are calculated, weighted and combined to produce a single life risk value against geographic features or an automatically created grid.
- Link Related Risk: As well as analysing risk within geographic areas, risk on different stretches of road can be calculated using road-incident data. Snapping and assigning incidents to the road network can be performed to create a density report which describes the number of incidents per mile.
- Route Cost Risk: Calculate the time it takes for appliances to mobilise to defined locations, using the road network. It can identify those areas that are outside the benchmark attendance targets and therefore potentially have a high level of risk.
All risk modelling uses thematic mapping for the presentation of results. Pre-defined themes or heat maps quickly identify and compare risk between scenarios. Results are created as schema columns on existing or new datasets, automatically archiving the scenario and allowing multiple risk combinations to be compared and contrasted. Cadcorp Risk Modeller is designed to be uncomplicated and easy to understand and allows Fire Services to adopt a consistent and repeatable methodology.
For more information, go to http://cdcp.io/risk

You must be logged in to post a comment.